Student
Response Sheet
1.
Name three essential components of habitat (things animals need to
survive).
a. Food
b. Shelter
c.
Water
2.
Explain what caused the increase of “deer” during the activity you participated in.
The increase of population was caused by the large portion of food resources.
3.
Explain what caused the decrease of “deer” during the activity you participated
in. The decrease of deer was caused by the low limited supply of resources available of the high level of deer population
4.
Define the term limiting factor. Give examples of limiting factors for the deer in our activity. The limiting factor of this lab are resources available to sustain a population.
5.
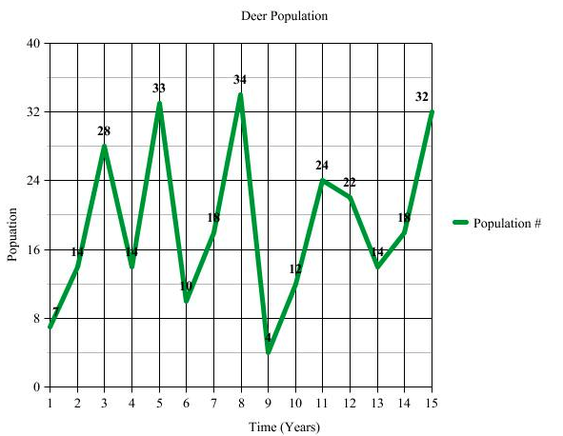
Graph the data from the activity and attach to this sheet (make sure to correctly title and label the axes). Describe what the graph of our data looks like. How and why did our deer population change?
The graph shows
how the number of deer population change throughout every year at a constant rate. At the population of 34 the species has reached its maximum capacity and had its lowest at a population of 4
The population of deer throughout the years changed due to the amount of resources left in that time period.
6.
Often we use the phrase “balance of nature” to describe a healthy ecosystem. Based on our graph, what does the “balance of nature” look like? Should we expect populations to be static (unchanging) or do they naturally fluctuate? Explain.
Based on the information of this graph, there's an obvious fluctuation during each number of each year and how the population increases and decreases at a same rate.
7.
What did you learn about population dynamics by doing this activity?
The population of an ecosystem is based on limiting factors and carrying capacities. The amount of resources in at a certain time period will determine the population number for that year. This means that populations are never static and always fluctuate a steady rate.
Response Sheet
1.
Name three essential components of habitat (things animals need to
survive).
a. Food
b. Shelter
c.
Water
2.
Explain what caused the increase of “deer” during the activity you participated in.
The increase of population was caused by the large portion of food resources.
3.
Explain what caused the decrease of “deer” during the activity you participated
in. The decrease of deer was caused by the low limited supply of resources available of the high level of deer population
4.
Define the term limiting factor. Give examples of limiting factors for the deer in our activity. The limiting factor of this lab are resources available to sustain a population.
5.
Graph the data from the activity and attach to this sheet (make sure to correctly title and label the axes). Describe what the graph of our data looks like. How and why did our deer population change?
The graph shows
how the number of deer population change throughout every year at a constant rate. At the population of 34 the species has reached its maximum capacity and had its lowest at a population of 4
The population of deer throughout the years changed due to the amount of resources left in that time period.
6.
Often we use the phrase “balance of nature” to describe a healthy ecosystem. Based on our graph, what does the “balance of nature” look like? Should we expect populations to be static (unchanging) or do they naturally fluctuate? Explain.
Based on the information of this graph, there's an obvious fluctuation during each number of each year and how the population increases and decreases at a same rate.
7.
What did you learn about population dynamics by doing this activity?
The population of an ecosystem is based on limiting factors and carrying capacities. The amount of resources in at a certain time period will determine the population number for that year. This means that populations are never static and always fluctuate a steady rate.